Canada’s Most Stolen Cars of 2025: What Theft Risk Costs You, Model by Model
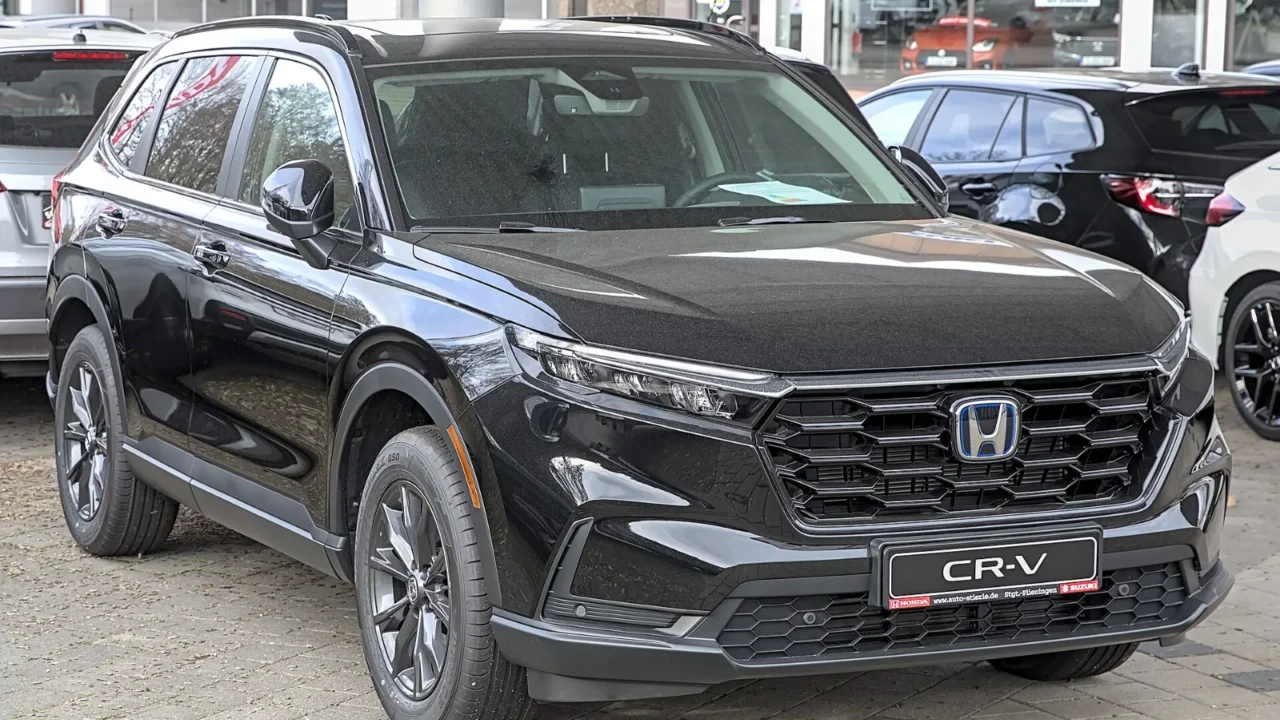
The Honda CR-V is Canada's most stolen vehicle again, with 2,137 thefts in 2025. Its theft rate is only 0.39%, while 11% of insured Lexus TX SUVs were stolen. We turned Équité's 2025 data into the yearly cost of theft risk for each model.

In this article
The Honda CR-V is again Canada’s most stolen vehicle. Équité Association, the insurance industry’s anti-fraud body, released its 2025 Top 10 on 10 November 2026. It counts 2,137 CR-Vs stolen last year, most of them in Ontario. But the CR-V tops the list mainly because so many are on the road. Some newer luxury SUVs are nearly 30 times more likely to be stolen. We turned Équité’s theft rates into dollars: what theft risk adds to the cost of owning each vehicle, and what you lose even when you’re insured.
The short answer
For a typical CR-V, theft risk is worth about $156 a year nationally, or $240 in Ontario. For a Lexus TX, it’s over $9,000.
That is the vehicle’s value multiplied by the share of insured vehicles stolen in 2025. Your insurer prices this risk into your premium. The CR-V has the most thefts, but only 0.39% of insured CR-Vs were stolen. For the Lexus TX the figure was 11.37%, and for the Toyota Land Cruiser 11.32%.
Canada’s 10 most stolen vehicles of 2025
| # | Vehicle | Most stolen model year | Thefts | Insured | Theft rate |
|---|---|---|---|---|---|
| 1 | Honda CR-V | 2024 | 2,137 | 550,586 | 0.39% |
| 2 | Honda Civic | 2018 | 1,813 | 673,107 | 0.27% |
| 3 | Toyota RAV4 | 2021 | 1,147 | 614,269 | 0.19% |
| 4 | Ram 1500 Series | 2022 | 1,072 | 500,931 | 0.21% |
| 5 | Ford F-150 Series | 2023 | 1,057 | 593,365 | 0.18% |
| 6 | Lexus RX Series | 2024 | 964 | 103,338 | 0.93% |
| 7 | Chevrolet/GMC Silverado/Sierra 1500 | 2018 | 927 | 585,240 | 0.16% |
| 8 | Toyota Tundra | 2024 | 787 | 82,578 | 0.95% |
| 9 | Jeep Wrangler | 2024 | 603 | 149,295 | 0.40% |
| 10 | Hyundai Elantra | 2023 | 484 | 389,339 | 0.12% |
Source: Équité Association, Top 10 Most Stolen Vehicles of 2025, ranked by number of thefts (Canada). “Theft rate” = thefts ÷ vehicles insured.
The real risk: theft rate, not theft count
Équité also ranks vehicles by the share of insured vehicles stolen (minimum 50 thefts). This list is dominated by new, expensive SUVs:
| # | Vehicle | Theft rate | Stolen / insured |
|---|---|---|---|
| 1 | Lexus TX Series (2024) | 11.37% | 279 / 2,455 |
| 2 | Toyota Land Cruiser (2025) | 11.32% | 253 / 2,236 |
| 3 | Toyota Grand Highlander (2024) | 4.77% | 480 / 10,059 |
| 4 | Toyota Sequoia (2023) | 1.53% | 94 / 6,140 |
| 5 | Land Rover Defender (2022) | 1.39% | 79 / 5,671 |
| 6 | Acura TLX (2021) | 1.32% | 317 / 23,989 |
| 7 | Lexus GX Series (2025) | 1.09% | 54 / 4,947 |
| 8 | Mercedes-Benz GLS (2025) | 1.04% | 51 / 4,921 |
| 9 (tie) | Land Rover Range Rover Series (2016) | 0.95% | 344 / 36,047 |
| 9 (tie) | Toyota Tundra (2024) | 0.95% | 787 / 82,578 |
Source: Équité Association, Top 10 Most Stolen Vehicles of 2025, ranked by theft frequency (Canada). The model year shown is the year with the highest theft rate.
What theft risk is worth in dollars
A simple way to see theft risk is its expected yearly cost: the vehicle’s value multiplied by the chance it’s stolen in a year. This is roughly the part of your premium that pays for theft, before the insurer’s costs and profit. The values below are round examples, not market prices.
| Vehicle and region | 2025 theft rate | Example value | Expected theft cost per year | Chance of theft over 5 years* |
|---|---|---|---|---|
| Honda CR-V, Quebec | 0.27% | $40,000 | $108 | 1.3% |
| Honda CR-V, Canada | 0.39% | $40,000 | $156 | 1.9% |
| Honda CR-V, Ontario | 0.60% | $40,000 | $240 | 3.0% |
| Toyota Tundra, Ontario | 2.06% | $70,000 | $1,442 | 9.9% |
| Toyota Grand Highlander, Ontario | 8.63% | $60,000 | $5,178 | 36% |
| Lexus TX, Canada | 11.37% | $80,000 | $9,096 | 45% |
*If the 2025 theft rate stayed the same every year: 1 − (1 − rate)5. Regional rates are from Équité’s Ontario and Quebec Top 10 lists.
A Grand Highlander has a much higher theft rate in Ontario (8.63%) than across Canada (4.77%). A rate like that explains why some owners of high-risk models face steep premiums, or are asked by insurers to fit tracking or immobiliser devices.
What a theft costs you even if you’re insured
- Your deductible: theft is covered under comprehensive (or all perils) coverage, minus your deductible. If you only carry the legal minimum coverage, a stolen vehicle isn’t covered at all.
- Depreciation: insurers normally pay the vehicle’s actual cash value, not what you paid. If you still owe more on your loan or lease than the vehicle is worth, you pay the difference unless you have gap or replacement-cost coverage (in Ontario, the OPCF 43 waiver of depreciation endorsement).
- Time without a vehicle: rental cover depends on your policy. It may run out before you’ve bought a replacement.
- Future premiums: even when a theft isn’t your fault, insuring a replacement of the same high-risk model can cost more.
See the full cost of owning your next vehicle
Our calculator compares the 10-year cost of an electric and a gas vehicle in Canada, including insurance, fuel or charging, maintenance and resale.
FAQ
What is the most stolen car in Canada?
The Honda CR-V, with 2,137 thefts in 2025 according to Équité Association’s list released on 10 November 2026. The 2024 model year was stolen most often. The Honda Civic (1,813) and Toyota RAV4 (1,147) were second and third.
Which vehicle has the highest theft rate in Canada?
The Lexus TX: 279 of the 2,455 insured in 2025 were stolen, a rate of 11.37%. The 2025 Toyota Land Cruiser was a close second at 11.32%.
What is the most stolen vehicle in Ontario?
Also the Honda CR-V, with 1,598 thefts in 2025 (0.60% of insured CR-Vs). Ontario’s highest theft rate on its Top 10 was the Toyota Grand Highlander, at 8.63%.
Is car theft going down in Canada?
Yes. Équité reported an 18% national decrease in 2025 compared with 2024, and a further 10.1% decrease in the first half of 2026 compared with the first half of 2025. Stolen vehicles still cost Canadians about $900 million a year.
How we calculated this
- Data: Équité Association’s 2025 Top 10 lists by number of thefts (Canada, Ontario, Quebec) and by theft frequency (Canada), published 10 November 2026.
- Expected theft cost: example vehicle value × 2025 theft rate. Real premiums also depend on your driving record, postal code, deductible and insurer.
- Multi-year odds: assume the 2025 rate repeats each year. That is a simplification: rates change as models age and as theft patterns shift.
Sources: Équité: Top 10 by number of thefts · Équité: Top 10 by theft frequency · Équité press release (10 Nov 2026) · Équité: first half of 2026 trend report

Faisal is the founder and editor of EV vs Gas Car Cost. He builds the site’s ownership-cost calculators and reviews new cars with one question in mind: what will this car really cost to buy, finance, fuel and run? His reviews are based on manufacturer specifications, official fuel-economy and efficiency ratings, and public fuel and electricity price data, which he cites in every article. He also publishes daily car review videos on his YouTube channel, CarRev3.